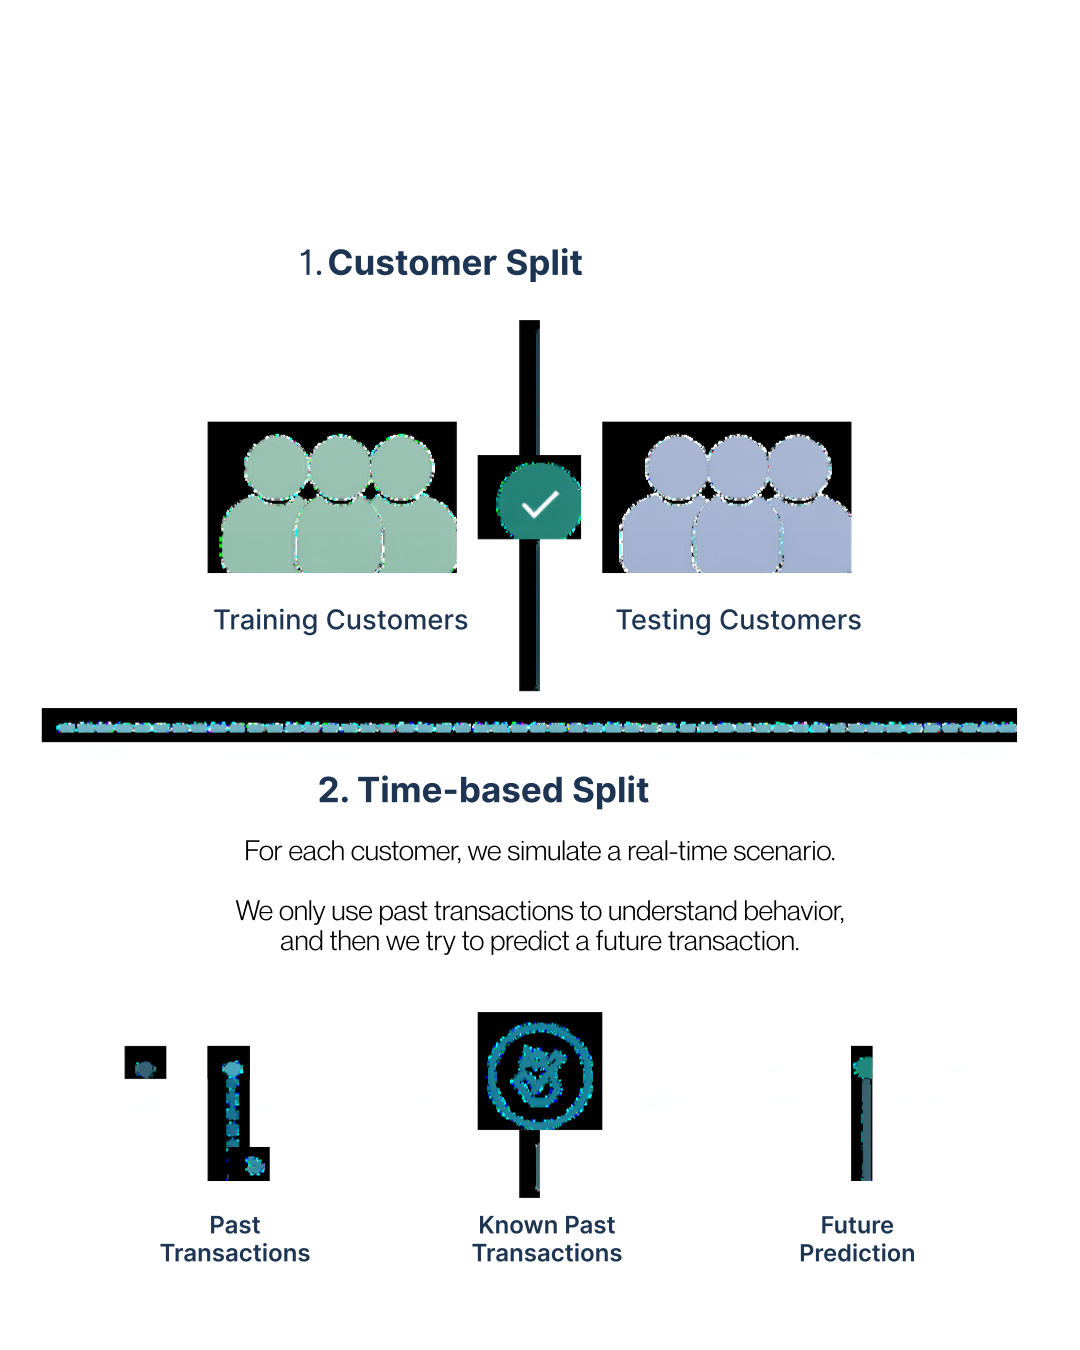
Using transactional data, we built a model that can detect fraud in real-time, reducing potential losses while controlling false alerts. The model identifies up to 70% of fraudulent transactions, capturing approximately 90% of the total fraud value.
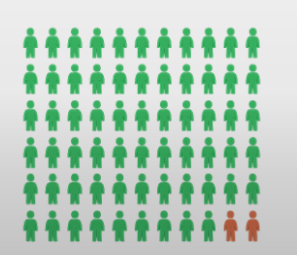
What would happen if the model just predicts everything as normal?
It would be 98% accurate — and still useless.
Dataset Overview
Dataset Overview
Summary
Table 1: Fraud vs Non-Fraud Summary
isFraud
Cases
Total_Amount
Case_Pct
Amount_Pct
Not Fraud
773946
$104,924,052
98%
97%
Fraud
12417
$2,796,506
2%
3%
Transaction
Table 2: Transaction by clients
Mean.Transaction
median.Transaction
Min.Transaction
max.Transaction
157.27
50
1
32850
The dataset is transaction-level financial data
Customer/account info
Transaction details (DataTime, Amount)
Merchant info (Name, type of business, location)
Obs.
Table 3: Observation Example
accountNumber
customerId
creditLimit
availableMoney
transactionDateTime
transactionAmount
merchantName
acqCountry
merchantCountryCode
posEntryMode
posConditionCode
merchantCategoryCode
currentExpDate
accountOpenDate
dateOfLastAddressChange
cardCVV
enteredCVV
cardLast4Digits
transactionType
currentBalance
cardPresent
expirationDateKeyInMatch
isFraud
transactionTime
737265056
737265056
5000
5000
2016-08-13T14:27:32
98.55
Uber
US
US
02
01
rideshare
06/2023
2015-03-14
2015-03-14
414
414
1803
PURCHASE
0
FALSE
FALSE
0
2016-08-13 14:27:32
Data Caveat
Data Caveat:
Identifying Reverse transactions:
Summary of Reversed Transactions
Cases
Total Amount ($)
Cases (%)
Amount (%)
17757
2666479
2.26
2.48
Data Caveat:
Error detection: There are some returns that do not have a prior purchase.
E.g.
dup_key
purchase_count
reversal_count
101376441_0_cheapfast.com_128_6683
0
1
Identifying multi-swipe:
Multi swipe, when a vendor accidentally charges a customer’s card multiple times within a short time span.
Summary of Multi-Swipe Transactions
Multi-Swipe
Cases
Total Amount ($)
Cases (%)
Amount (%)
1
20156
2201824
2.56
2.04
Key Insights
We explored patterns to understand what fraud looks like:
Transactions
Merchant types
CVV
Transactions:
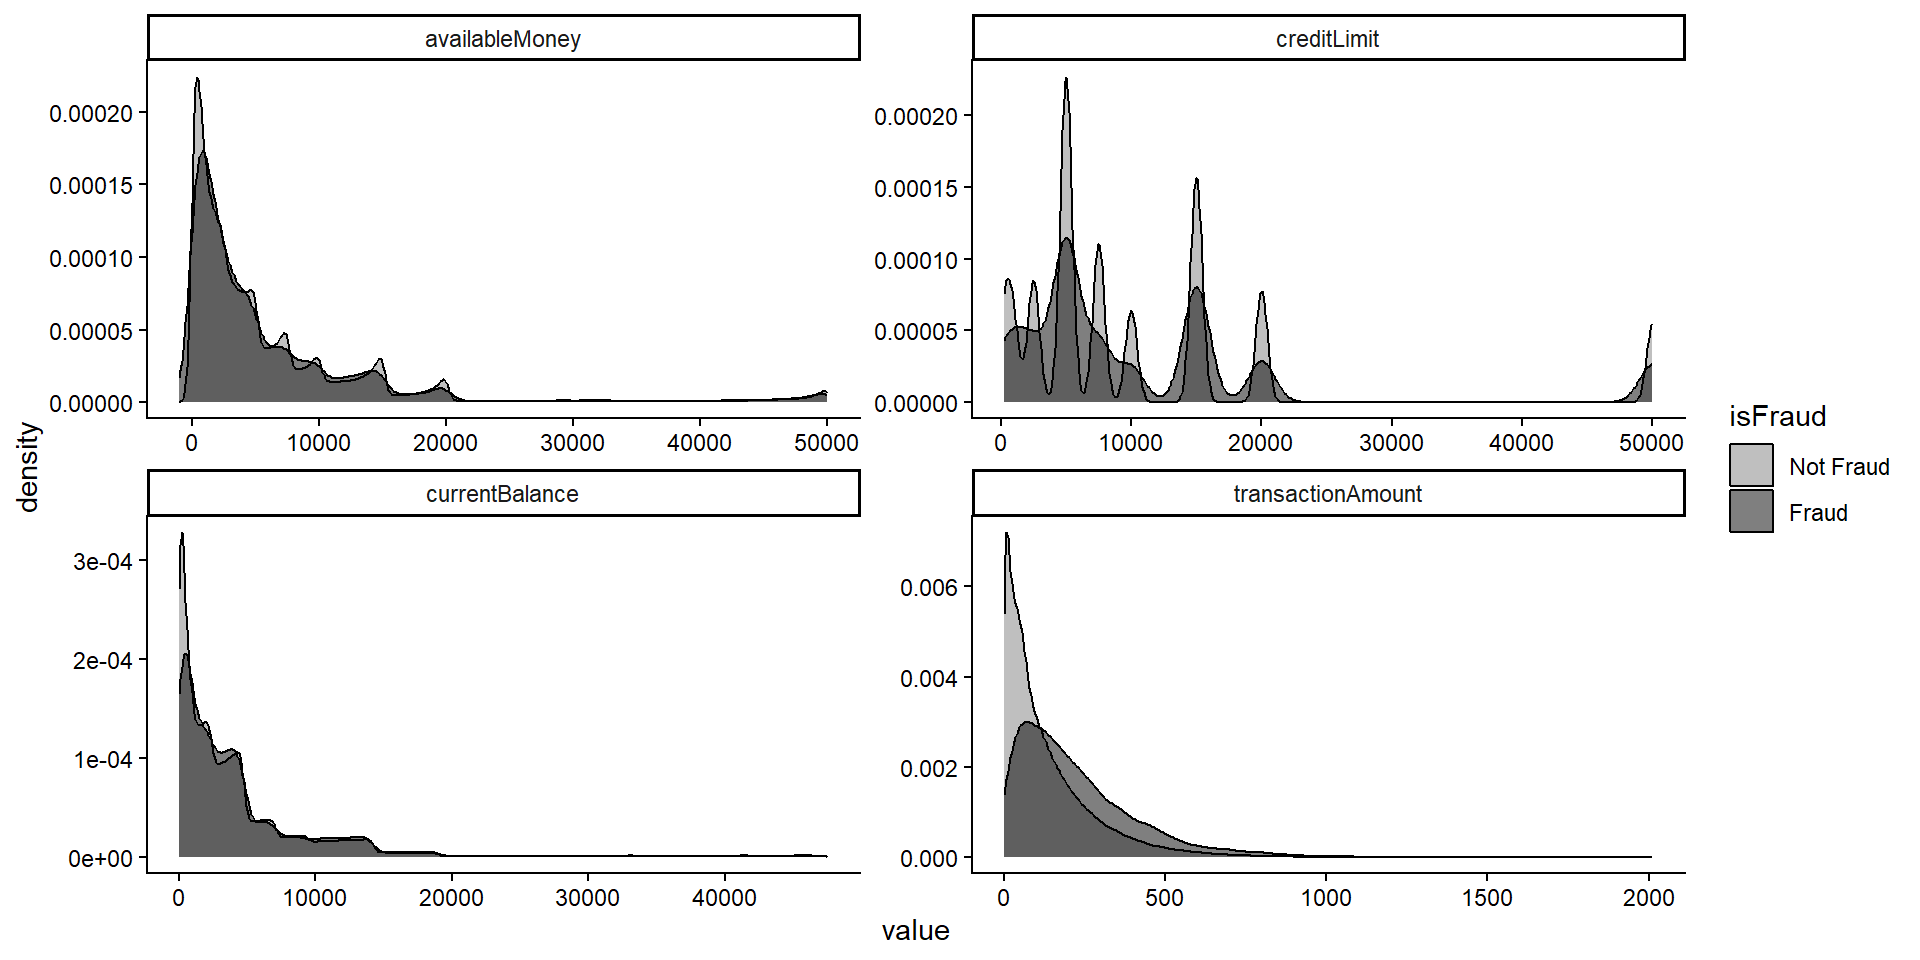
Fraudulent transactions tend to be larger than usual
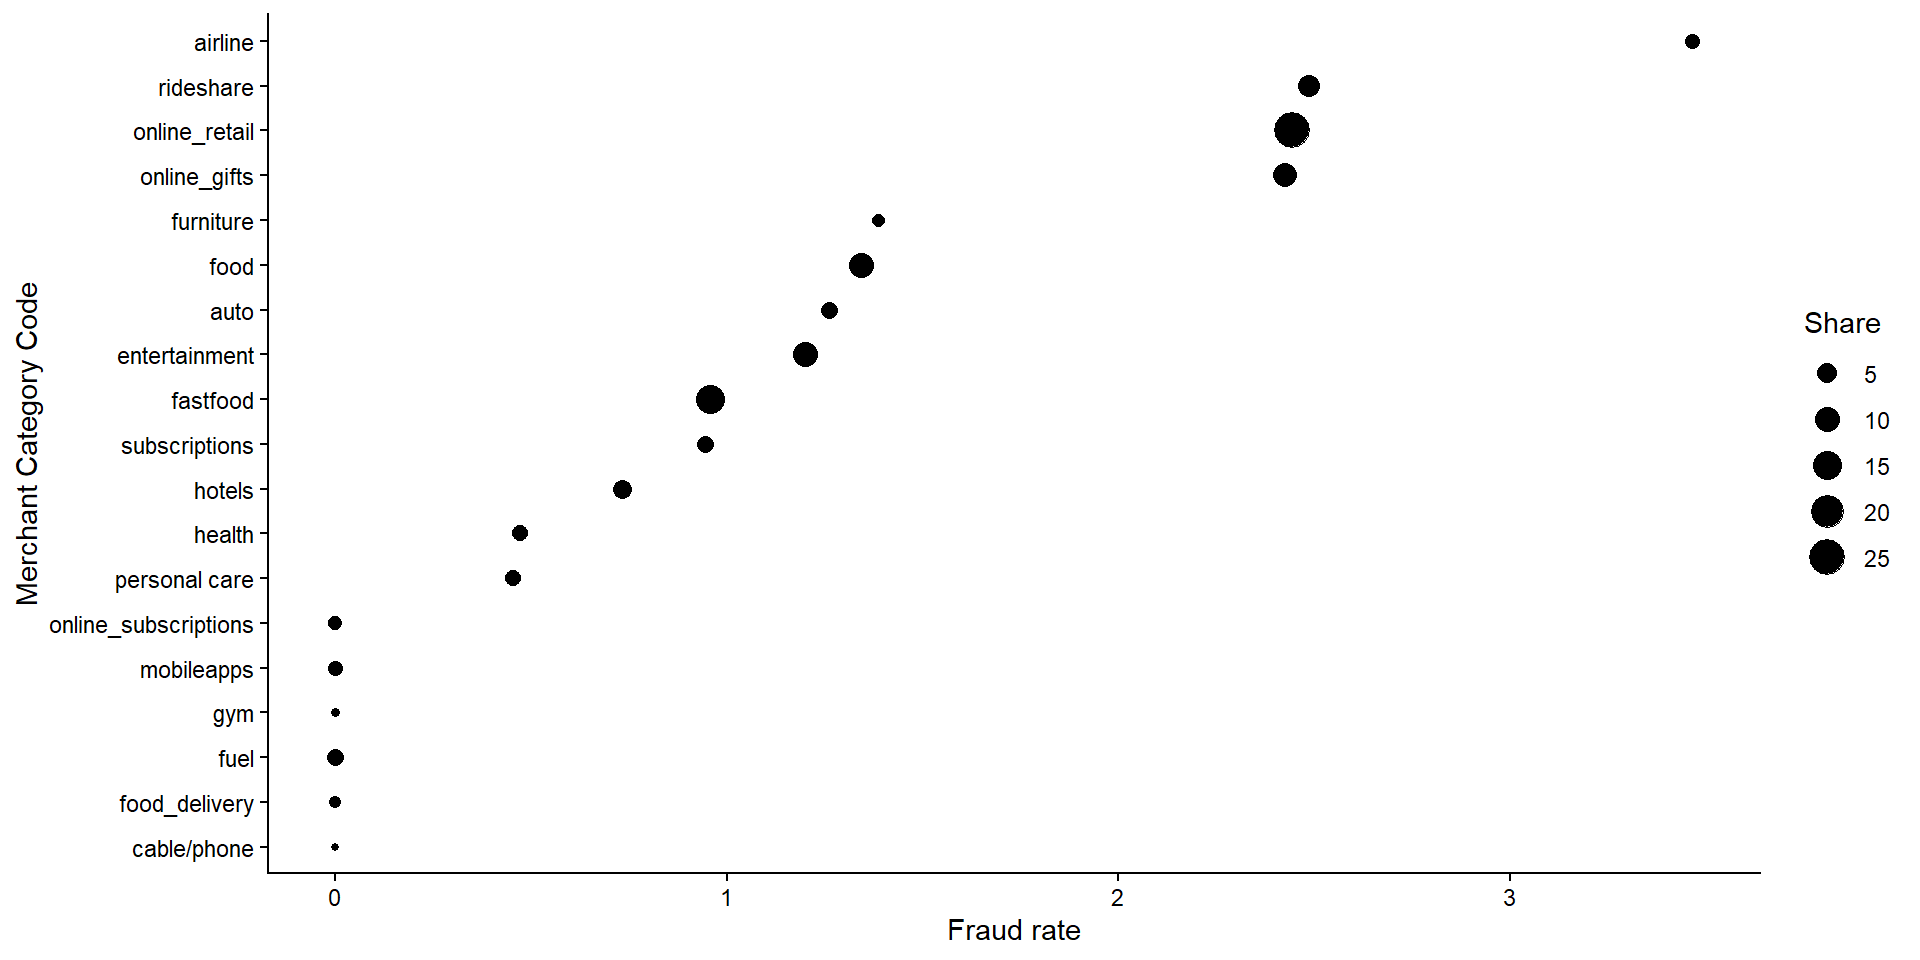
Fraud Varies by Merchant Type
E.g. Online purchases or travel-related transactions show higher fraud rates
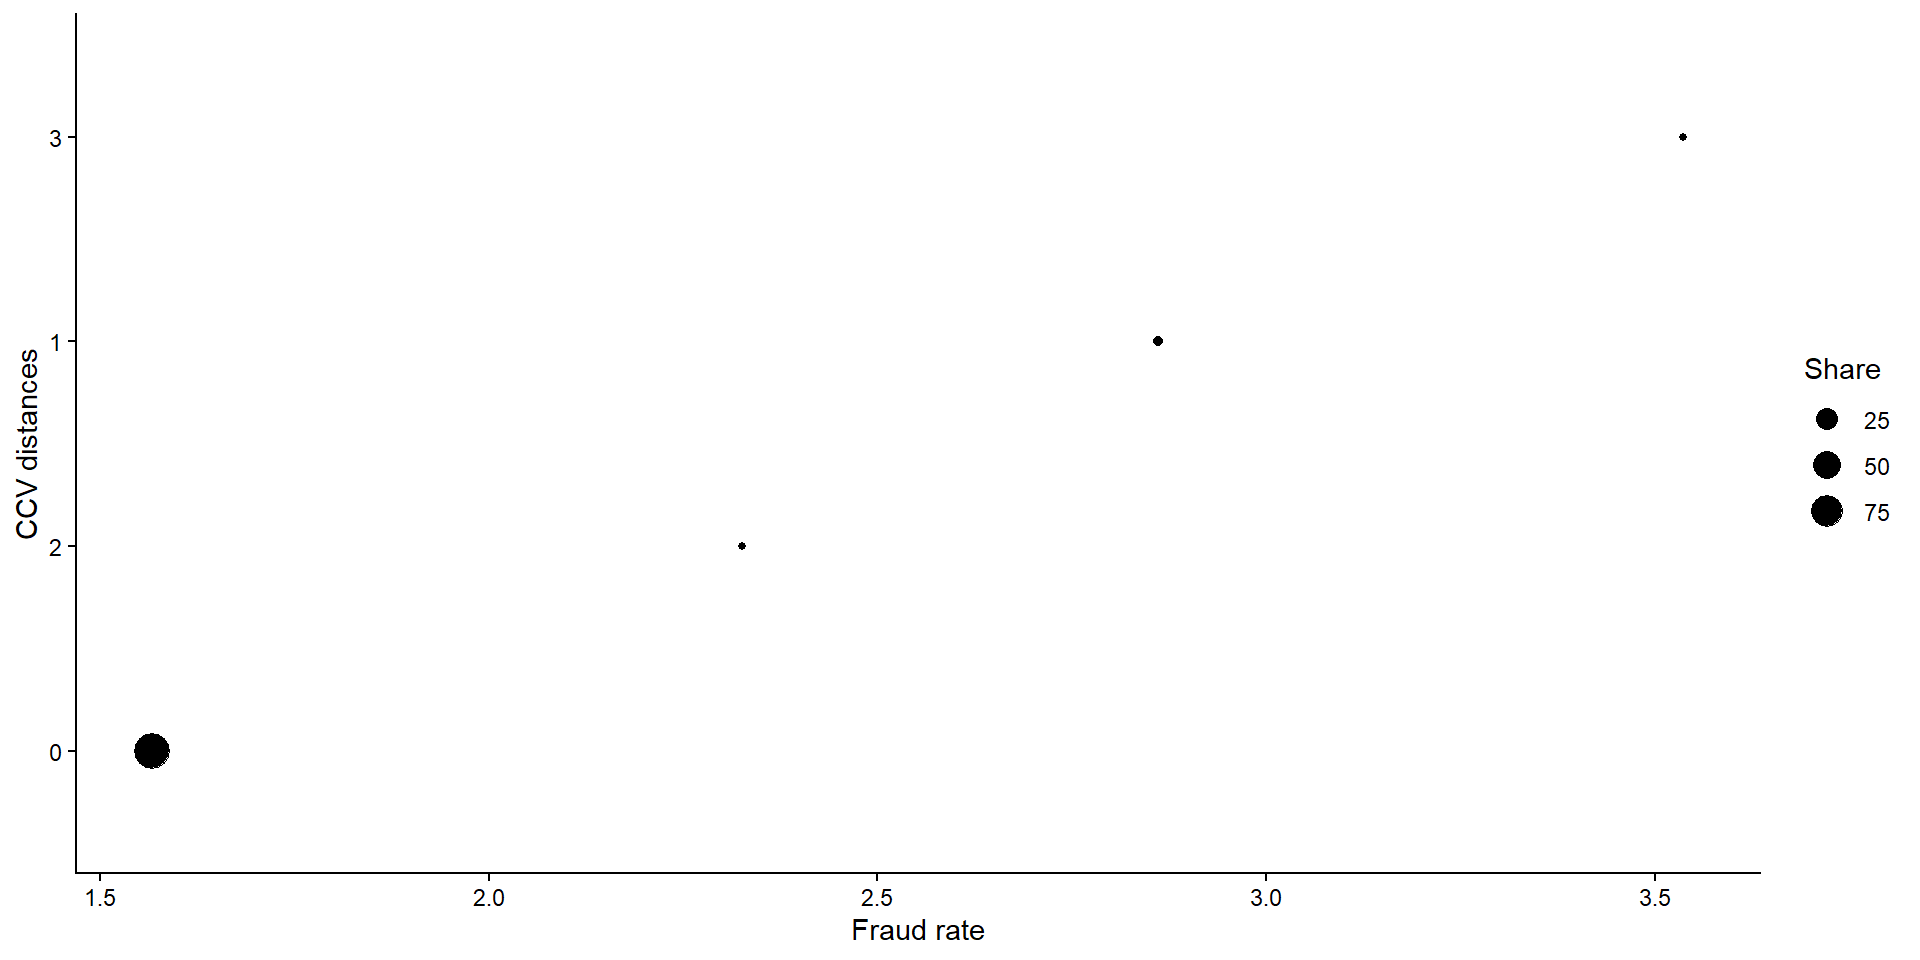
Errors in transaction details, such as incorrect CVV entries, are more common in fraud cases
Higher mismatch between entered and real CVV = higher fraud risk.
What does fraud look like?
Larger transactions
Unusual behavior
CVV mismatches
Specific merchant types
Feature Engineering / behavioral signals:
Think of fraud as behavior that looks different from a customer’s normal habits.
Timing patterns
Average Spend Last 7 days
Number of transactions in last 24 hours
New Merchant
Modeling Approach
Modeling Approach
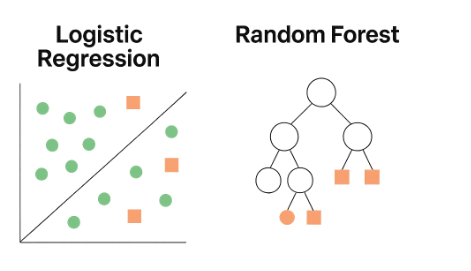
Logistic Regression → simple, interpretable
Random Forest → more flexible, captures complex patterns
Modeling Approach
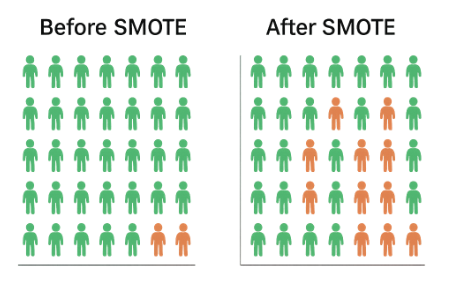
Rebalance the data
We also addressed the imbalance problem using techniques like SMOTE, which helps the model learn rare fraud cases better.
Business Impact:
Model Performance Comparison
Fraud Detection vs Customer Impact
Model
Recall (All Fraud)
Fraud Captured ($)
False Alerts / 10K
Net Benefit
Random Forest
78.6%
90.6%
255
$2,050
Logistic Regression
21.4%
37.0%
73
$977
Decision Criteria:
If the primary goal is to minimize false negatives and ensure that most fraud cases are identified, then the logit model may be the better choice despite its higher false positive rate.
Conversely, if the focus is on achieving greater overall accuracy and reducing false alarms, the random forest model could be better, provided that the cost of missed fraud is acceptable.
Top 5 Random Forest Drivers
Recent spending behavior is the strongest predictor
Unusual transactions relative to a customer’s history increase risk
Time of transaction (hour) plays a significant role
Transaction size relative to normal patterns matters
Day of week also influences fraud patterns
Top 5 Logistic Regression Drivers
Deviation from customer mean → ↑ fraud risk (1.83x)
Fuel transactions → ↓ fraud likelihood (0.42x)
Mobile apps → ↓ fraud likelihood (0.44x)
Online subscriptions → ↓ fraud likelihood (0.54x)
Hotels → ↓ fraud likelihood (0.61x)
Conclusion
Fraud is rare, but predictable
Fraud is driven by behavioral anomalies
The key is balancing detection vs customer experience
Fraud leaves patterns — our job is to detect them early
Q & A
Thank you!
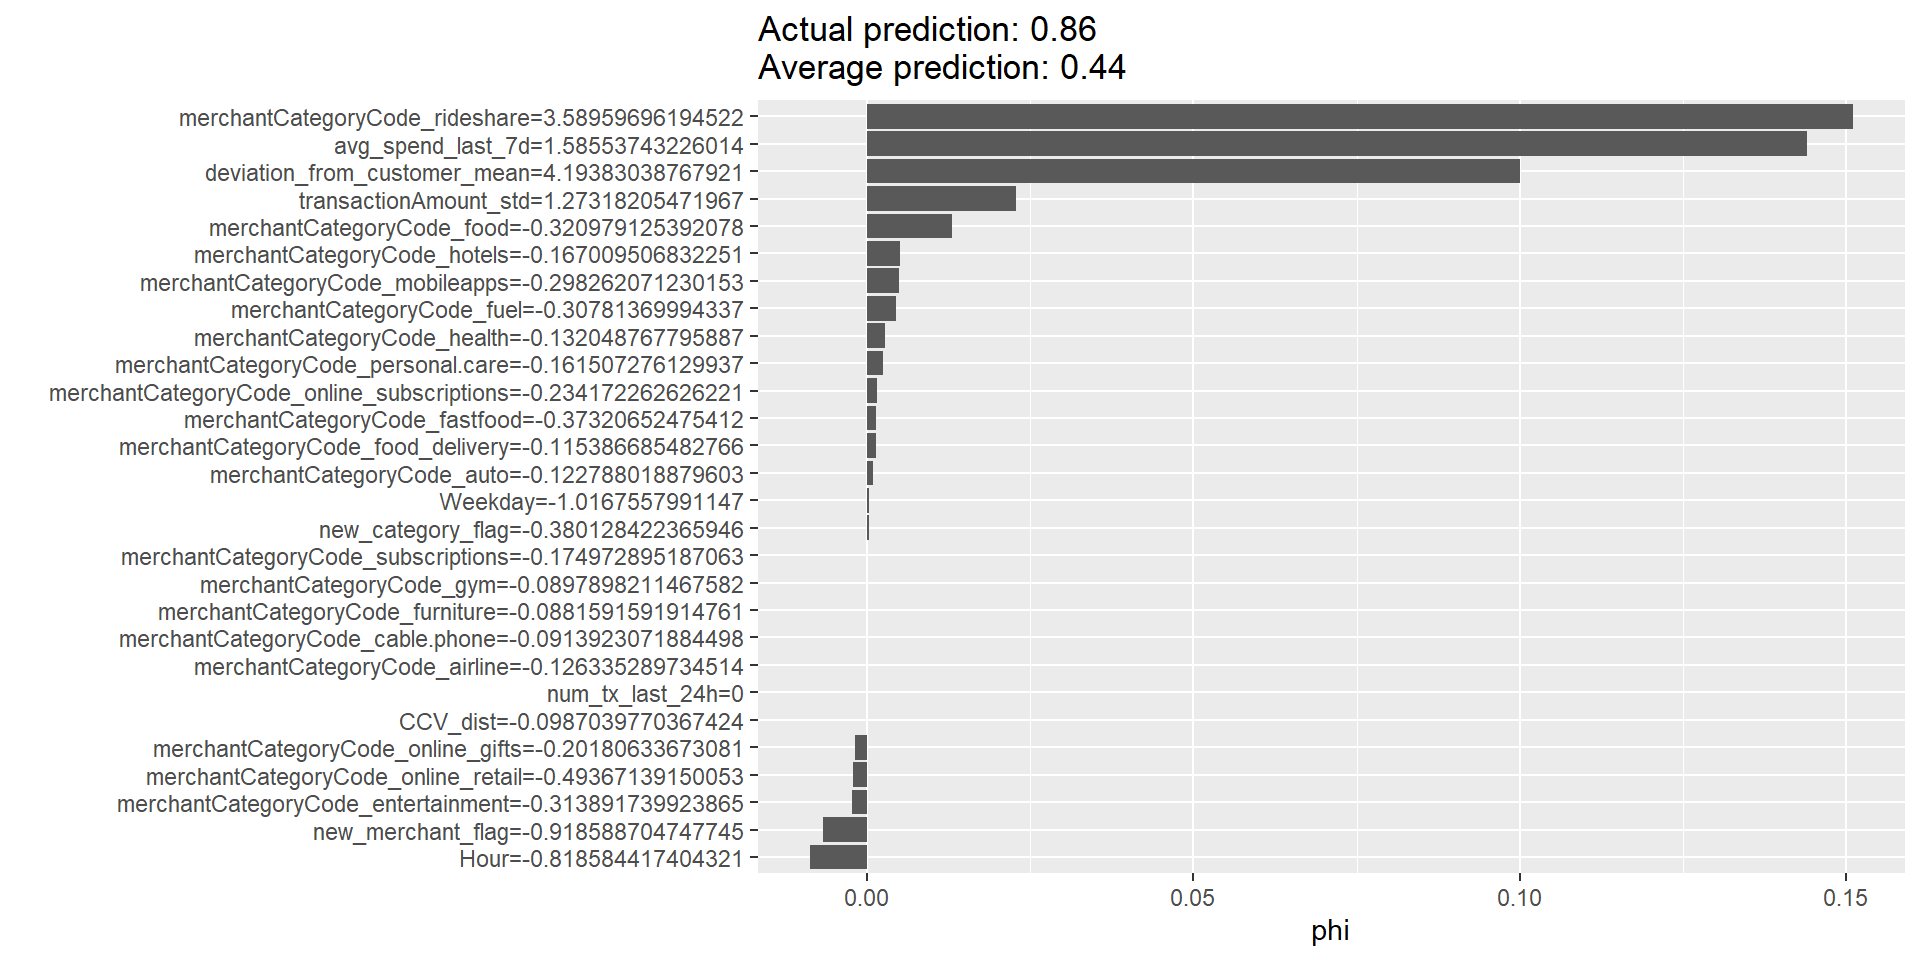
Why was a transaction flagged? SHAP
Stacking
            Transaction
                 |
          ┌──────┴──────┐
          |             |
       Logistic        Random
      Regression       Forest
          |             |
      Fraud Prob.   Fraud Prob.
          \             /
           \           /
            \         /
              Model

                  |
                  |
         Final Fraud Score
The idea is:
Logistic Regression captures simple linear relationships
Random Forest captures nonlinear interactions
A meta-model learns when to trust each model
“Two fraud analysts review the transaction independently, and a third analyst makes the final decision.”
Ensemble / Stacking
No single model sees all fraud patterns.
Model Performance Comparison
Fraud Detection vs Customer Impact
Model
Recall (All Fraud)
Fraud Captured ($)
False Alerts / 1K
Net Benefit
Random Forest
78.6%
90.6%
255
$2,050
Logistic Regression
21.4%
37.0%
73
$977
Stacked Ensemble
78.6%
90.6%
219
$2,212
While the ensemble combined insights from both Logistic Regression and Random Forest, the Random Forest model delivered the strongest fraud detection performance in this analysis. Nonetheless, the ensemble demonstrates how multiple models can be combined into a single risk score, potentially increasing robustness and reducing dependence on a single algorithm.