Visualization Exercise: Retail Stores
Exercise
Scenario
You are a data analyst working for a retail company.
The back-to-school season is approaching, one of the most important commercial events of the year.
You have received the results of a customer survey where both your customers and your competitors’ customers evaluated stores across different dimensions.
At first glance, some results are positive:
customers rate your store better than competitors in several areas.
Your team is brainstorming how to present these results. In particular, they want to: - Highlight strengths - Identify areas for improvement - Propose next steps
Your task
Design a clear and effective visualization to present the results.
👉 Think of your presentation as a story: - Introduction - Climax - Conclusion
Identifying the Story Components
Introduction
- What actions did we take?
- What problem are we trying to solve?
- What data are we using?
Climax (Evidence)
- What did we learn from the data?
- Where do we outperform the competition?
- Where are we falling behind?
Conclusion
- What recommendations can we make?
- What concrete actions should follow?
Exploring the Data
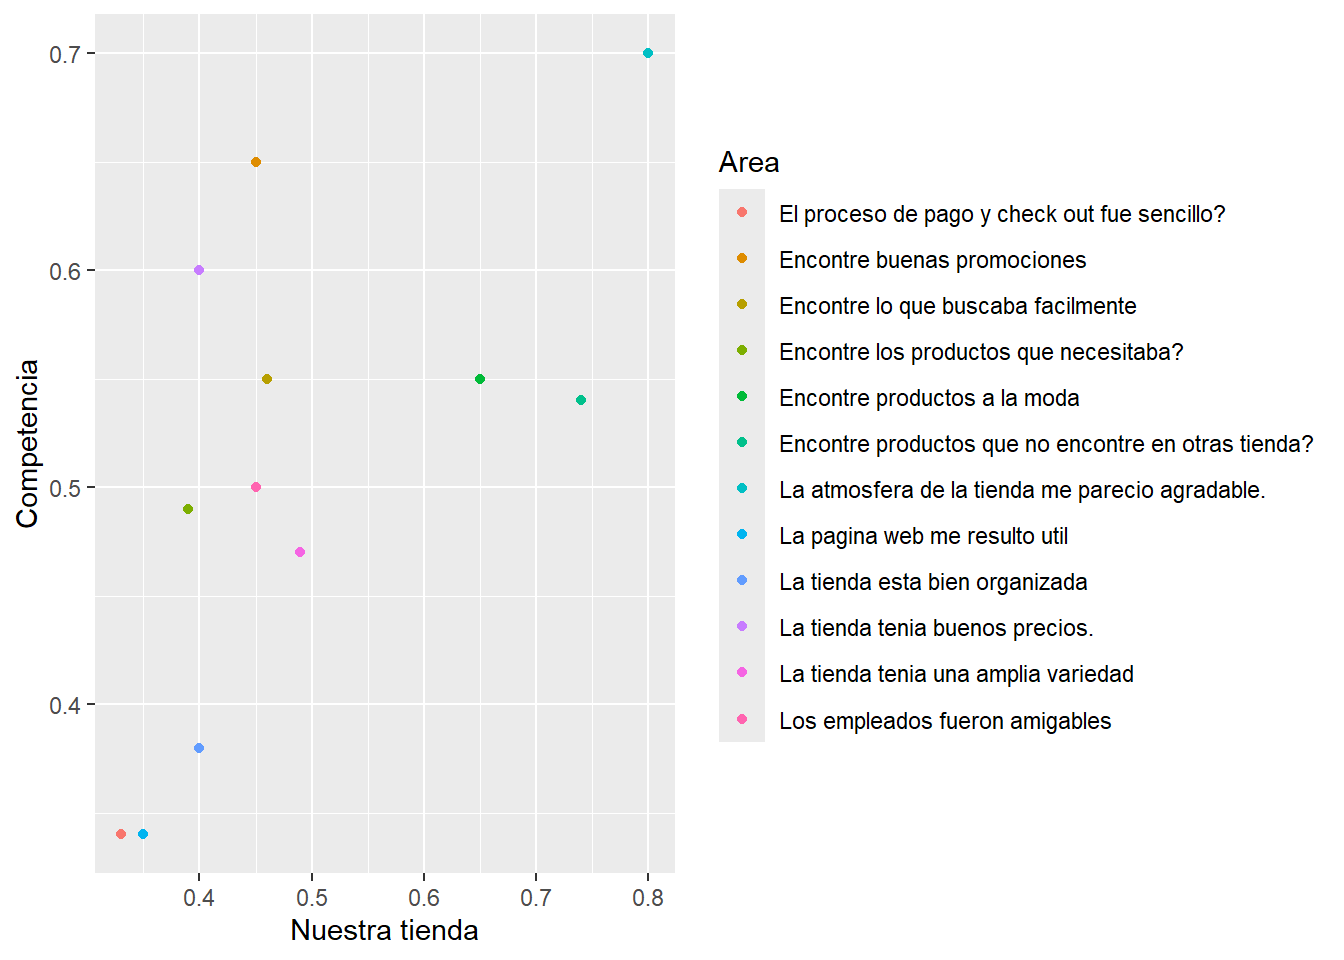
first approach
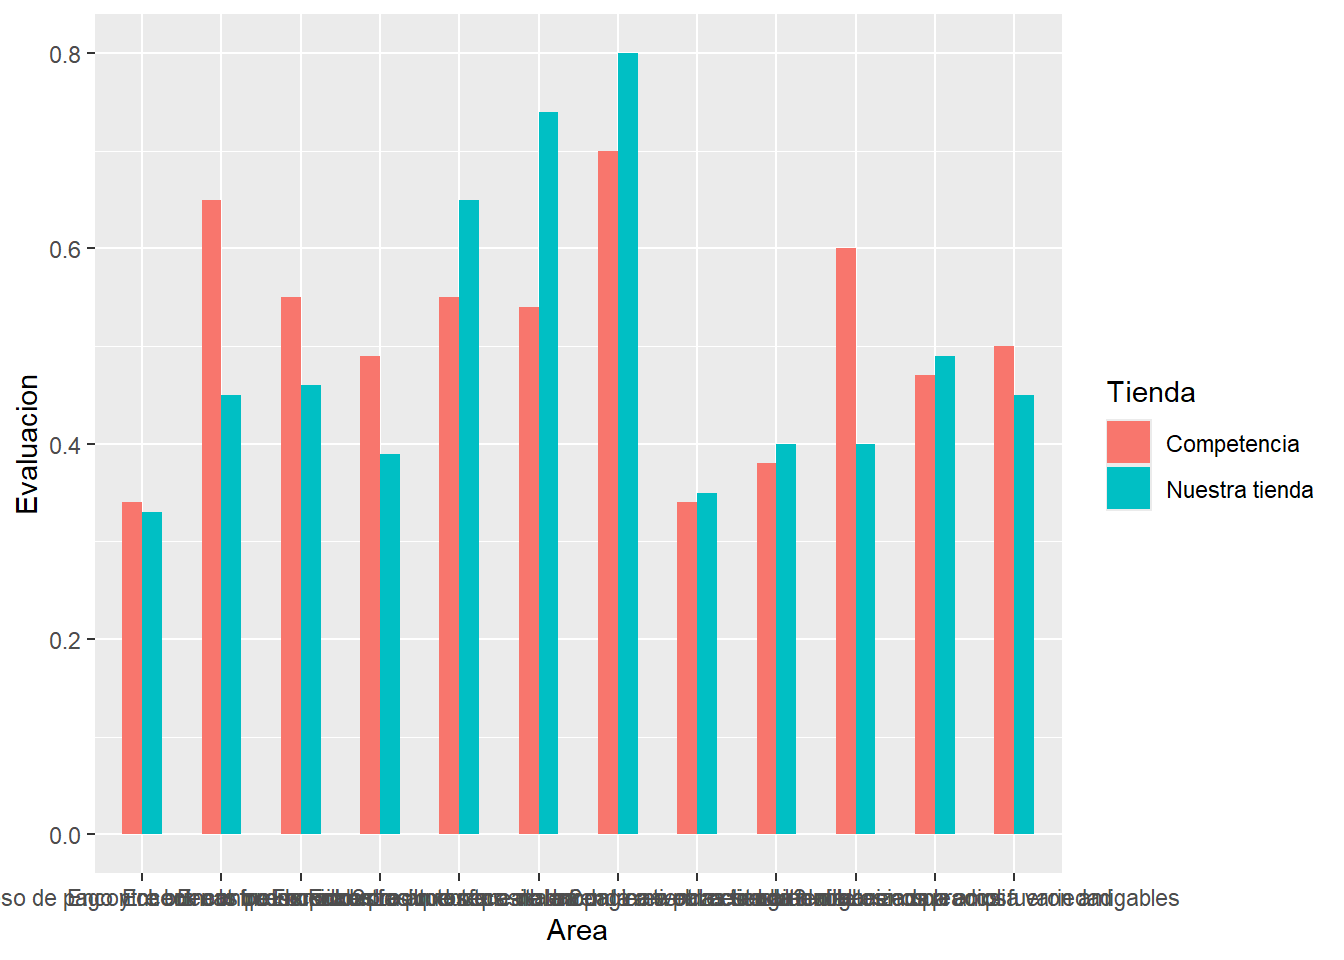
Other type of plot…
mmmm Maybe….
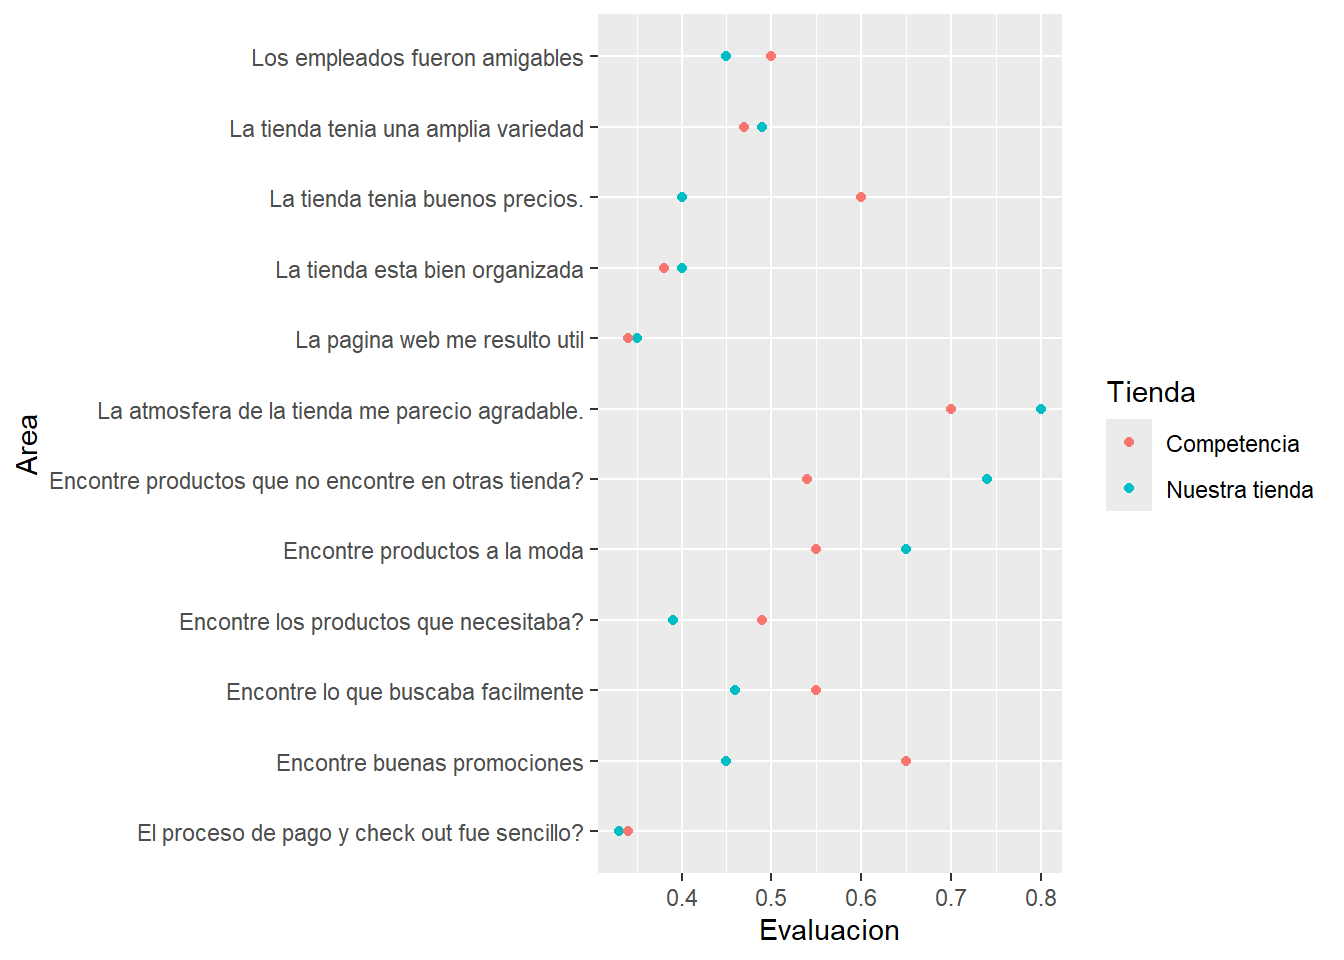
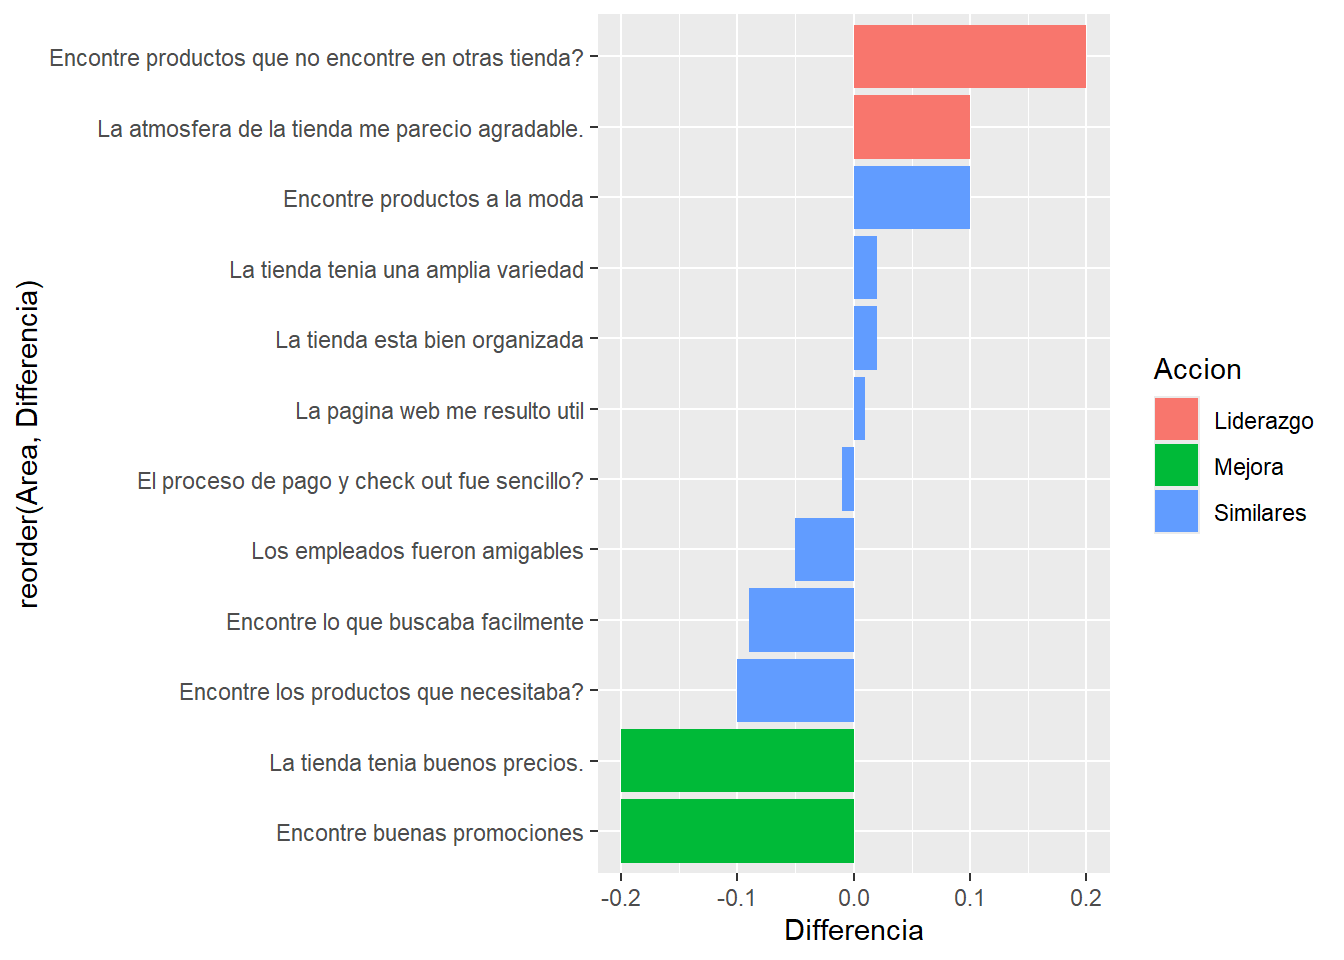
Barplot for the win
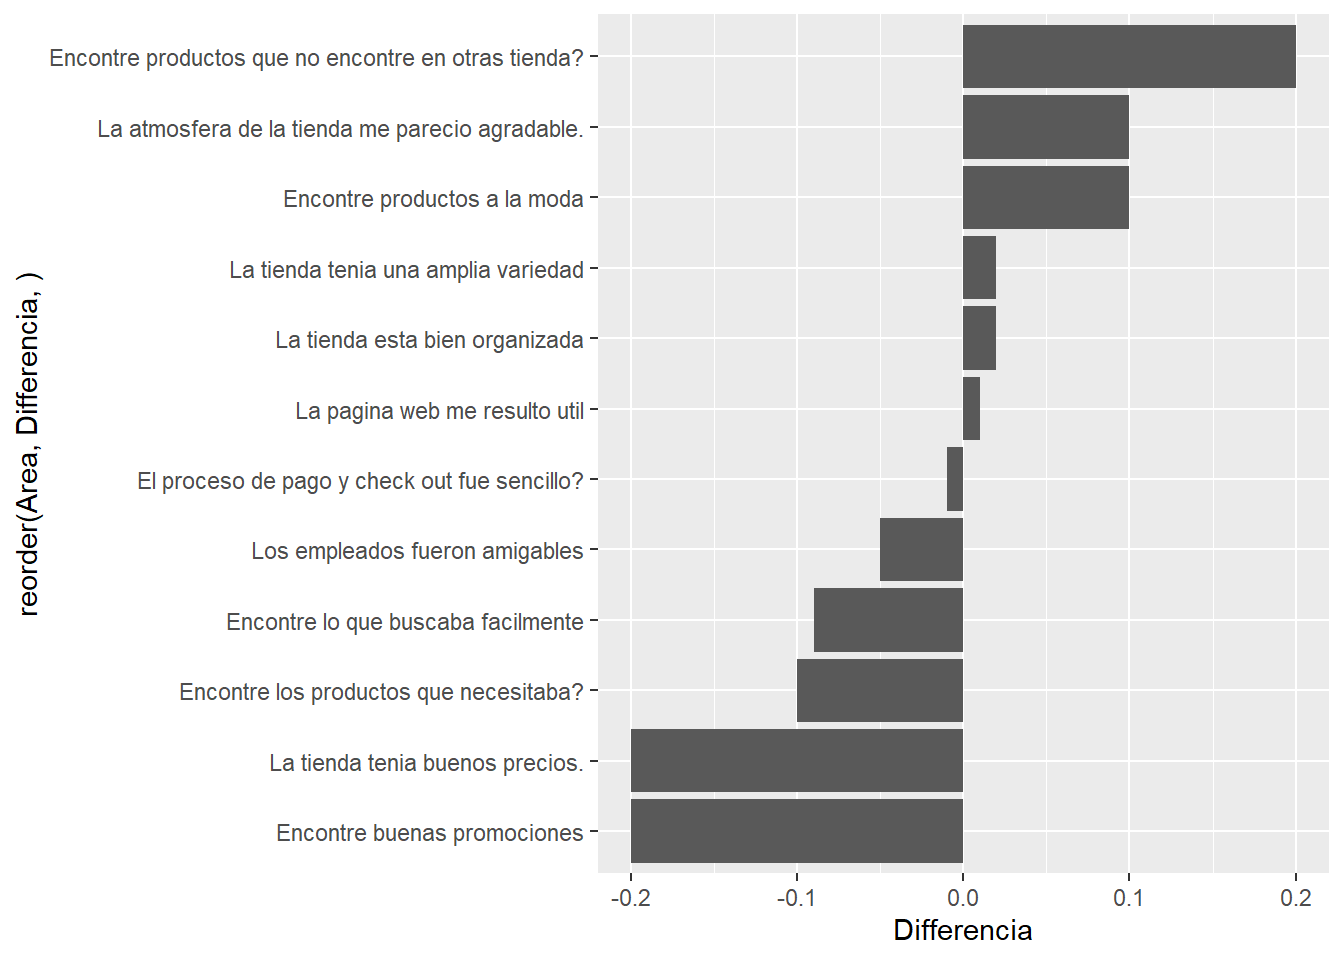
Make it better
final
